The Gulf of Maine is an international watershed in the North Atlantic stretching north from Provincetown at the tip of Massachusetts Bay in the Commonwealth of Massachusetts to Cape Sable on the Bay of Fundy in the province of Nova Scotia in Canada. For over 13,000 years, the Gulf has been developed around access to the coast for fishing, trading, and recreation. Today, these coastal development patterns put the cultural landscapes, economies, communities, and aging infrastructure systems along the Gulf at risk.
Climate Futures on the Gulf of Maine uses place-based scenario planning to illustrate the risks, vulnerabilities, and plausible futures for ten infrastructure systems along the rim of the Gulf. Place-based scenario planning is a method of long-term strategic planning that creates representations of multiple, plausible futures that are used to inform decision-making in the present. While complementary to probabilistic models used to forecast future vulnerabilities, scenario-based planning shifts emphasis from statistical probability to ways of thinking about the future. The goal of place-based scenario planning is not to predict the most likely outcome, but to reveal biases and blind spots in complex and non-linear situations.
Climate Futures uses the medium of landscape representation to surface the cultural value systems embedded in existing infrastructural systems, and position landscape as a driver when evaluating design from individual infrastructures to the Gulf of Maine watershed.
What is the Gulf of Maine?
The Gulf of Maine is both a hydrological unit created 16,000 years ago during the Late Pleistocene epoch,1 and an administrative region that has been defined by the Gulf of Maine Council on the Marine Environment.2 The boundaries of the Gulf are defined and communicated through cartographic tools, namely watershed maps.
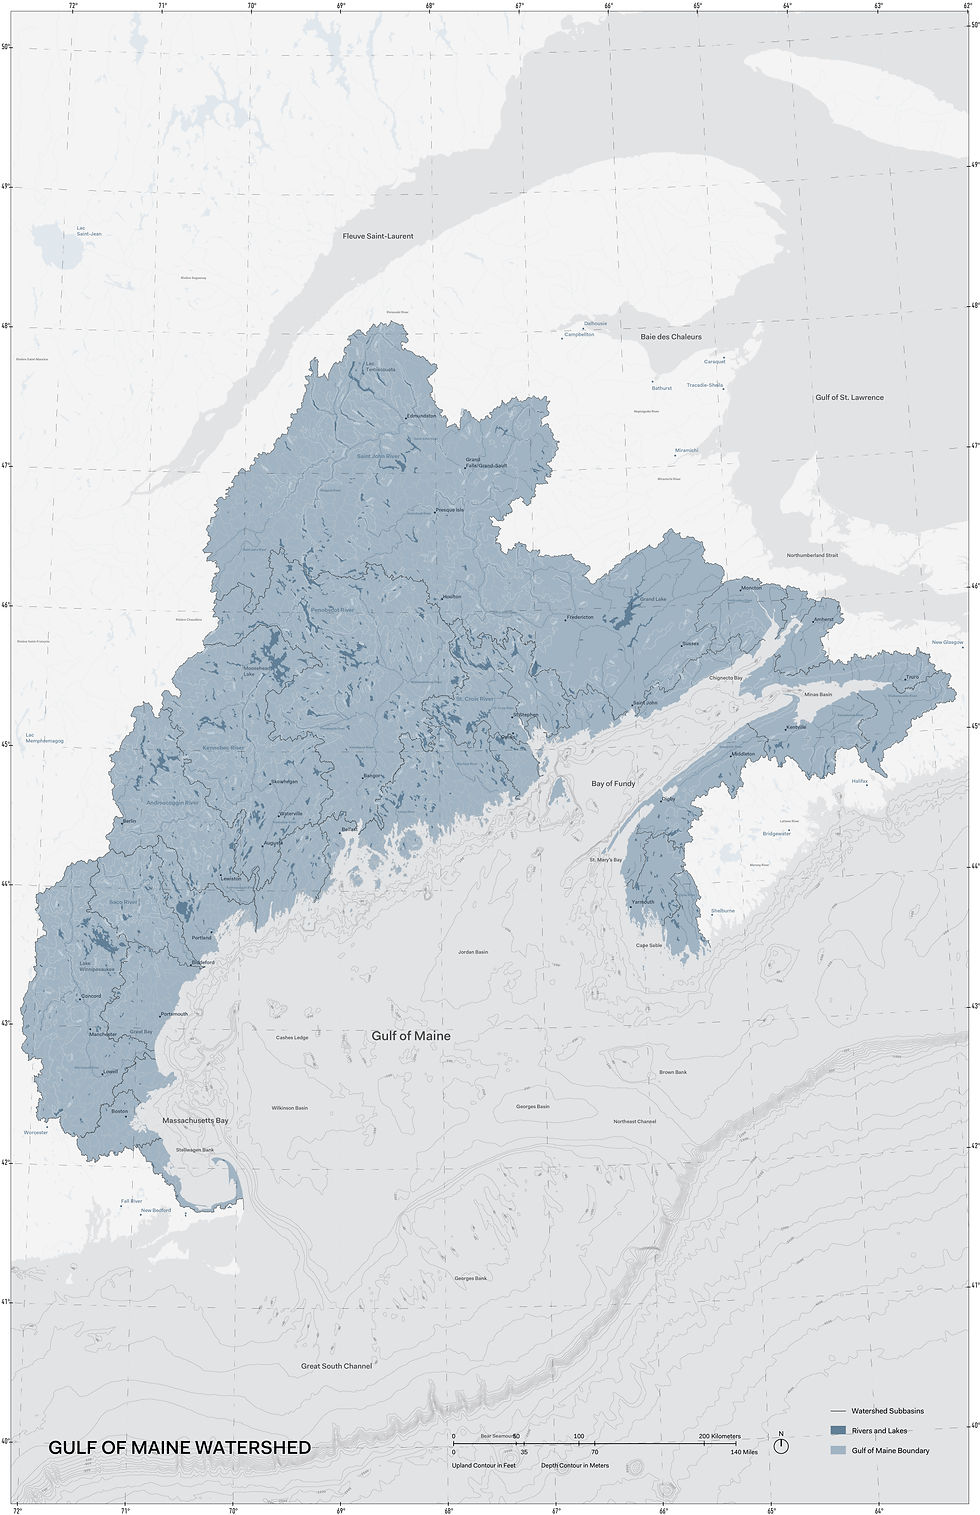
The Gulf of Maine watershed. Adapted from Richard D. Kelly, Gulf of Maine Watershed (Augusta, ME: Maine State Planning Office, 1991).
As one of its first tasks, the Gulf of Maine Council on the Marine Environment produced a watershed map delineating the boundaries of the watershed in 1991.3 The map does not include political boundaries, only the international watershed boundary, topographic and bathymetric contours, as well as rivers, lakes, and large population centers.4 The map establishes the Gulf of Maine as an international commons, and provides a visual identity for the region.5 The authors of this report recreated the map to further understand the places and infrastructure systems on the Gulf through the lens of the watershed.
The watershed map is used to communicate the Gulf as an ecological reality. The following statements are called critical certainties in the place-based scenario planning process. These are statements that are known and descriptive about a place, and serve to establish other social, technological, economic, ecological, political, and legal realities on the Gulf of Maine. While stakeholders can make decisions that address these Certainties, they are beyond the sphere of control of any single individual or group on the Gulf of Maine.
Taken together, these statements offer a portrait of the identity of the Gulf of Maine and its infrastructure systems today, and a jumping off point to imagine different, alternative scenarios for the Gulf.
The Gulf of Maine is a semi-enclosed international watershed in the northeastern Atlantic Ocean.
The Gulf of Maine is an international watershed,6 stretching north from Provincetown at the tip of Massachusetts Bay in the Commonwealth of Massachusetts to Cape Sable on the Bay of Fundy in the province of Nova Scotia in Canada.7 8 Across the watershed, water drains from high points across the 69,115 square miles (165,185 square kilometers) land area of the watershed into river valleys before passing through the fringing salt marsh, and finally into the ocean.9 Any pollutants, contaminants, debris, or sewage that do not infiltrate into the soil eventually drain to the Atlantic Ocean.
The underwater topography of the Gulf partially isolates the Gulf of Maine from the Atlantic Ocean. It includes ridges on the Georges and Browns Banks that create a nearly enclosed circulatory system of ocean currents. The Gulf of Maine is at the convergence of the southern Labrador Current, which brings cold Arctic waters through the Northeast Channel between Georges Bank and Nova Scotia, and the Gulf Stream, which brings warm water from the south and moves offshore. There is more water input from the Labrador Current, which has historically kept the Gulf of Maine waters colder relative to the waters south of Cape Cod and Georges Bank.10 11
The Gulf is warming 97% faster than other oceans on the planet.
In addition to habitat destruction and overfishing, the Gulf’s sea surface temperatures12 are warming faster than other parts of the world.13 14 By 2050, sea surface temperatures will increase between 1 and 2.75°C (1.8-4.95°F). At the same time, sea surface salinity15 will decrease due to freshwater from rivers, precipitation, and Greenland glacial melt.16 These impacts will vary by depth. In the deep ocean basins on the Gulf, temperatures and salinities are projected to increase.17
There has recently been a decrease in cold water from the Labrador Current due to melting Arctic sea ice. As sea ice melts, it releases fresh water into the Arctic Ocean, redirecting the Labrador Current. An increasing amount of warm water now enters the Gulf of Maine through the Gulf Stream at depths from 0 to 300 meters below the surface.18 These changes affect both aquatic and terrestrial systems, as the ocean affects climate and weather on land by storing solar radiation, distributing heat and moisture, and driving weather systems.19
Warming waters on the Gulf of Maine cause thermal expansion, which has driven sea level rise along the Gulf of Maine. Over the past 100 years, the coast of the northeastern United States has seen around 10” of sea level rise. While ten inches may seem minimal, the National Oceanic and Atmospheric Administration (NOAA) reports that a half foot of vertical change in sea level leads to an average of fifty-three feet of horizontal beachfront lost along the coast. These changes are accelerating, with projections from the National Oceanic and Atmospheric Administration (NOAA) anticipating 12-20” of sea level rise (0.31 to 0.52 meters) by 2050, and 23-86” (0.6 to 2.2 meters) by 2100.20 More powerful hurricanes are expected bring storm surges on top of higher sea levels.21
Like sea levels, temperatures have risen in the northeastern United States by 2°F (1.12°C) since 1895, and are expected to rise 4.5°F (2.52°C) to 10°F (5.56°C) by the 2080s, with more frequent, intense, and long heat waves. Precipitation patterns will also become more erratic, with heavy rainfall in winter and spring, and droughts during the summer.22
At the same time, the Atlantic Meridian Overturning Circulation (AMOC) is weakening, and rapid warming of the Gulf is expected to increase with the collapse of the circulation system between 2057 and 2083.23
These impacts will lead to shifting ranges or marine life, including species that have defined the cultural imaginary along the rim of the Gulf, like the American lobster (Homarus americanus), Atlantic cod (Gadus morhua), and Atlantic sea scallops (Placopecten magellanicus).24
The Gulf of Maine was developed around access to the ocean for fishing, shipbuilding, trading, and sailing.
The Gulf’s geology and climate provide what marine biologists call a basin whose, “overall environment for the production of planktonic marine life seems ideal; a garden where climate, topographic geometry, and general oceanographic factors come together in productive harmony.”25 The base of the marine environment has supported robust fishing and shellfishing industries, which have been and continue to be centered around productive estuaries26 along the coast that also provide sheltered harbors and access to maritime trade.27 Today, 11.4 million people live in the Gulf of Maine region, and half of those people live in the coastal zone.28
These coastal communities and islands have developed distinct cultures, economies, and ways of living in relation to the ocean. Many of these places were developed over and on top of existing Indigenous settlements.29 30
As colonial populations grew around working waterfronts, centralized infrastructure systems were constructed to support these developments. Often, these systems were constructed reactively in response to natural disasters or public health outbreaks, and built in places that were considered wastelands, like saltmarshes. While these systems helped to solve sewage problems and bring fresh drinking water into towns and villages, they also increased the number of people, buildings, and impervious surfaces in these sensitive coastal environments. As a result, these habitats have significantly degraded over time.31
The Gulf of Maine watershed is managed as a series of political jurisdictions administered across municipal, state, provincial, and national boundaries.
Despite shared issues across the watershed, including pollution from sewage; ongoing coastal development in vulnerable areas; and wildlife, waterfowl, and fisheries habitat destruction, the Gulf is managed as a series of political jurisdictions, not as an ecosystem.32 33
Across the Gulf, there are different, sometimes overlapping or conflicting jurisdictions for coastal management and environmental policies. This is particularly true of fisheries management, which is generally managed on a species-by-species basis by federal governments without considering the broader marine ecosystem.34 All of these jurisdictions operate within regulatory frameworks that can impede adaptation efforts.35
The quantity, quality, and accessibility of risk, scientific, economic, census, and planning data varies across administrative jurisdictions.
International efforts like the Gulf of Maine Council on the Marine Environment rely on participation and cooperation between various state and provincial governments, but do not have regulatory power to make decisions for the watershed.
Information on hazards, risks, and vulnerabilities are essential to make informed climate adaptation decisions, yet this data is produced, analyzed, disseminated, and communicated unequally.36 Reliable and accessible data is needed to assess infrastructure and climate vulnerabilities to make informed management decisions. Currently, the data that is available is fragmented and siloed across municipalities, states, agencies, and institutions. This data is not produced or disseminated equally. This is especially true in smaller municipalities and under-resources communities, which lack the capacity to analyze existing data in service of adaptation, let alone produce new information.37
Further, existing data is often unreliable. There is a lack of a basic inventory of infrastructure assets, and the data that does exist is not collected in a standardized format that can be easily shared and used. Easily accessible, publicly available infrastructure data is the foundation for decision-makers to analyze information and allocate funding and collaborate on critical large-scale infrastructure projects that cross jurisdictional boundaries.38
The vast majority of infrastructure systems in the Gulf of Maine were designed to meet outdated standards.
Across the United States and Canada, centralized infrastructure systems were built in the twentieth century, largely in the post-war period in response to population growth.39 40 41 The systems are beyond their expected life cycles, and they have not been invested in or maintained, let alone replaced.42 43
These systems were designed to meet environmental standards, like average temperature and precipitation standards, that are changing in the climate crisis, when 100-year storms have become 10-year storms. They are also interconnected and dependent on each other, the internet, and software systems that did not exist when they were designed. The different stakeholders in these systems do not have an understanding of their dependencies, interdependencies, and the associated cascading effects that could be triggered and compounded by climate hazards.44
Aging infrastructure systems are increasingly vulnerable to extreme weather events and natural disasters.
These systems increasingly pose a risk to public safety and the economy across the Gulf.45 Outside of the four metropolitan areas on the Gulf of Maine: Boston, Massachusetts; Portsmouth, New Hampshire; Portland, Maine; and St. John, Newfoundland, the Gulf of Maine is comprised of small and midsized local governments that serve smaller cities, towns, and villages.46 These governments have limited capacity to adapt to climate change, and have historically seen less centralized infrastructure investment.47
This presents two different types of challenges for governments on the Gulf: metropolitan areas have limited resources to adapt aging centralized systems, while smaller communities have fewer resources to build and repair systems. At the same time, systems developed in coastal areas are increasingly vulnerable to climate impacts, including sea level rise storm surge. These include direct impacts, like inundation of low-lying roads and causeways, and broader systemic impacts like increased ambient air temperatures, increasing coastal aquifer salinity, and temperature increases.48 49
Infrastructure systems that have been developed in historic wetlands are likely to flood again in the near future.
Before colonial times, salt marshes50 covered much of the northeastern United States and Maritime Canada throughout the Gulf of Maine.51 Across New England 50% of salt marshes are estimated to have been lost since colonization.52 53 This is part of a greater trend across the United States, where it is estimated that 53% of all wetlands have been lost.54 The trend is similar north in Canada. Just 15 percent of the original Bay of Fundy marshes remain. The rest were diked and turned into fertile agricultural land to halt the flow of tidal water onto the land.55
Many infrastructure systems along the Gulf were constructed in former wetland areas, which were historically seen as wastelands. These landscapes were considered unproductive, and were filled with rubble, soil, and garbage to support development on impervious surfaces,56 including critical infrastructure systems like railways and later highways, as well as wastewater and water treatment plants with gravity-fed collection systems.57
These systems have significantly altered infiltration and the way water flows through the greater watershed, and are likely to flood again in the near future. Restoring wetland systems can reduce the risk of coastal flooding, mitigate wave energy during major storms, and buffer inland areas from flooding.58 Restoration cannot return these landscapes to their prior condition before they were disturbed. Instead, restored landscapes are nature-based solutions59 that are designed to perform as a type of ecological infrastructure60 that provide ecosystem benefits like the ones above.
Decentralized approaches combine structural infrastructure and nature-based solutions.
While comprehensive plans are made almost every decade, the extended lifespan of the infrastructure systems on the Gulf make clear that the decisions made, budgets allocated, and technologies adopted today will have lasting impacts throughout the end of the century.61 Current federal and state capital investments in infrastructure projects often pass on the costs of maintaining built systems to local municipalities who do not have the funding or human capacity to manage these systems. This means that, even if there was financially possible, replacing existing systems is not a sustainable solution to manage infrastructure.
While the current infrastructural paradigm on the Gulf of Maine favors centralized, monolithic, gray infrastructure62 systems, decentralized63 alternatives exist and have been designed in other places for each system, from wastewater to electricity to transportation.
The shift toward decentralized infrastructure systems64 requires decision-making that prioritizes infrastructure construction in different ways and in different places than systems have previously been constructed on the Gulf of Maine.65
This approach is necessary, as the increasing amount of sprawl development in the Gulf of Maine, including in rural areas, has led to decreasing opportunities to use built infrastructure to mitigate flood damages, requiring increasing attention to nature-based solutions that invest in landscape as infrastructure.66 Proactive investment in resilient systems is estimated to avoid $13 in damage for every $1 spent.67
Individuals, groups, and governments are actively experimenting with infrastructure adaptation on the Gulf of Maine.
These include advancements from hazard mitigation planning68 and risk assessment69 70 to design,71 conservation,72 and implementation to policy and regulation, as well as improved community engagement and awareness building. Many of these best practices and lessons learned remain siloed and therefore difficult to scale.
While regulations and design standards are becoming more stringent in some places, they remain determined by political jurisdictions, not watersheds, vulnerable coastal areas, or sensitive ecosystems. Maintaining these boundaries and rebuilding existing systems that disregard the ecology of the places they are constructed in threatens not only individual landscapes and places, but the health of the larger watershed: the Gulf of Maine.73
1 An epoch is a unit of geologic time. Each epoch is defined by global-scale changes to planet Earth. There is currently a debate in the field of geology as to whether the Holocene epoch has ended, and whether we have moved into a new epoch, called “the Anthropocene” epoch. The term “Anthropocene” was first coined by a Russian geologist in 1922, and refers to the “magnitude, variety, and longevity of human-induced changes, including land surface transformation and the changing of the atmosphere.” Geographers Simon L. Lewis and Mark A. Maslin suggest that the start of the Anthropocene is either in 1610 or 1964. The choice of date is important, as it places emphasis on the arrival of Europeans in the Americas, or the first use of the Atomic bomb as defining moments in our planet’s history. See Simon L. Lewis and Mark A. Maslin, “Defining the Anthropocene,” Nature 519 (2015): 171·80.
2 The Gulf of Maine Council on the Marine Environment’s mission is “to maintain and enhance environmental quality in the Gulf of Maine to allow for sustainable resource use by existing and future generations.” “About the Council,” Gulf of Maine Council on the Marine Environment, accessed June 5, 2025, www.gulfofmaine.org/public/gulf-of-maine-council-on-the-marine-environment/about-the-council.
3 Richard D. Kelly, Gulf of Maine Watershed (Augusta, ME: Maine State Planning Office, 1991), collections.leventhalmap.org/search/commonwealth:bk12dn70k.
4 The map communication model (MCM) is a cartographic theory that describes how maps serve to communicate information from the map maker to the reader, and therefore requires an understanding of the power dynamics in which maps are produced. The map is not a value-free image, and choices of what to include or exclude are a way of communicating values and structuring understanding of the world In the case of the Gulf of Maine watershed map, the agenda is to shift understanding of the Gulf from a place with different states and nations toward a single ecosystem that is an international commons. Jeremy W. Crampton, “Maps as Social Constructions: Power, Communication and Visualization,” Progress in Human Geography 25, no. 2 (2001): 235–52.
5 Philip W. Conkling, ed., From Cape Cod to the Bay of Fundy: An Environmental Atlas of the Gulf of Maine (Cambridge, MA: MIT Press, 1995), 7.
6 The National Oceanic and Atmospheric Administration defines a watershed as “a land area that channels rainfall and snowmelt to creeks, streams, and rivers, and eventually to outflow points such as reservoirs, bays, and the ocean.” Watersheds are defined by topography. Water flows from high points, or ridges, downhill, eventually draining into the ocean. The path that water takes downhill defines the boundaries of a watershed. “What is a watershed?” National Oceanic and Atmospheric Administration, 2024, www.oceanservice.noaa.gov/facts/watershed.html.
7 The United States and Canada use different systems to classify watersheds across scales. The United States Geological Survey creates a series of “Hydrologic Unit Maps” that delineate watersheds in the US based on surface hydrologic features. These systems are identified by hydrologic unit codes (HUCs) followed by additional numbers that identify six levels of increasingly specific watershed hierarchies. In the United States, there are 22 watershed regions, 245 subregions, 405 basins, 2,400 subbasins, 19,000 watersheds, and 105,000 subwatersheds. As an example, Provincetown Municipal Airport is classified as being part of HUC 01 (New England water resource region); HUC 0109 (Massachusetts-Rhode Island Coastal subregion); HUC 010900 (Massachusetts – Rhode Island Coastal basin); HUC 01090002 (Cape Cod Subbasin); HUC 0109000202 (Cape Cod watershed); and HUC 010900020201 (Barnstable Harbor-Cape Cod Bay subwatershed). See Paul R. Seaber, F. Paul Kapinos, and George L. Knapp, “Hydrologic Unit Maps” (Denver, CO: United States Geological Survey, 1987), pubs.usgs.gov/wsp/wsp2294/pdf/wsp_2294.pdf.
8 The Water Survey of Canada creates a series of Canadian Hydrographic Units (CHUs) that delineate watersheds in Canada based on surface hydrological features and drainage basins. Ocean Drainage Areas are the largest designation, and describe which ocean watersheds empty into: the Arctic Ocean, Atlantic Ocean, Gulf of Mexico, Hudson Bay, or Pacific Ocean. As an example, Yarmouth Regional Hospital is located in the Atlantic Ocean Drainage Area; Maritime Provinces Major Drainage Area; Southeastern Atlantic Ocean Sub Drainage Area; and Tusket Sub Sub Drainage Area. Statisque Canada, “Standard Drainage Area Classification (SDAC) 2003,” February 16, 2009, www.statcan.gc.ca/en/subjects/standard/sdac/sdac.
9 The Gulf’s highest point is at Mount Katahdin at 5,270’ (1606 m), while its lowest point lies in Georges Basin at -1,200’ (-370m).
10 Alan D. Wanamaker et al., “Coupled North Atlantic Slope Water Forcing on Gulf of Maine Temperatures over the Past Millennium,” Climate Dynamics 31 (2008): 183–94.
11 Dan Seidov, Alexey Mishonov, and Rost Parsons, “Recent Warming and Decadal Variability of Gulf of Maine and Slope Water,” Limnology and Oceanography 66, no. 9 (2021): 3255–2595.
12 The National Oceanic and Atmospheric Administration (NOAA) defines sea surface temperature as “the temperature of the top few millimeters of the ocean. This temperature directly or indirectly impacts the rate of all physical, chemical, and most biological processes occurring in the ocean. SST is globally monitored by sensors on satellites, buoys, ships, ocean references stations, autonomous underwater vehicles and other technologies.” “Sea Surface Temperature,” National Oceanic and Atmospheric Administration, accessed September 1, 2024, www.ecowatch.noaa.gov/thematic/sea-surface-temperature.
13 Katherine E. Mills et al., “Fisheries Management in a Changing Climate,” Oceanography 26, no. 2 (2013): 191–95.
14 Andrew J. Pershing et al., “Slow Adaptation in the Face of Rapid Warming Leads to Collapse of the Gulf of Maine Cod Fishery,” Science 350, no. 6262 (2015): 809–12.
15 The National Oceanic and Atmospheric Administration (NOAA) defines sea surface salinity as the “ratio of salt (in grams) to liters of water” at the top few millimeters of the ocean. While the Atlantic Ocean is the saltiest ocean, sea water generally has a ratio of 33-37 grams per liter. The amount of salt in sea water determines the freezing temperature of sea water. The saltiest locations are the regions where evaporation is highest. See “Sea Water,” National Oceanic and Atmospheric Administration, accessed June 13, 2025, www.noaa.gov/jetstream/ocean/sea-water.
16 The Gulf of Maine Research Institute produces annual warming updates focusing on the sea surface temperatures on the Gulf of Maine. See “Annual Warming Update 2024,” Gulf Maine Research Institute, accessed June 10, 2025, www.gmri.org/stories/2024-gulf-of-maine-warming-update.
17 These projections of future climate impacts are created using a dynamic downscaling approach that uses global climate modeling completed by scientists at the Intergovernmental Panel of Climate Change (IPCC) at a finer scale resolution. Lucy Chisholm et al., “Projected Changes to Air Temperature, Sea-Level Rise, and Storms for the Gulf of Maine Region in 2050,” Elementa: Science of the Anthropocene 9, no. 1 (2021): 00059.
18 Vincent S. Saba et al., “Enhanced Warming of the Northwest Atlantic Ocean under Climate Change,” Oceans 121, no. 1 (2016): 118–32.
19 "How does the ocean affect climate and weather on land?” National Oceanic and Atmospheric Administration, accessed June 2, 2025, www.oceanexplorer.noaa.gov/facts/climate.html.
20 William V. Sweet, “Global and Regional Sea Level Rise Scenarios for the United States: Updated Mean Projections and Extreme Water Level Probabilities Along U.S. Coastlines” (Silver Spring, MD: National Oceanic and Atmospheric Administration, National Ocean Service, 2022).
21 Kerry Emanuel, “Evidence That Hurricanes Are Getting Stronger,” Proceedings of the National Academy of Sciences 117, no. 24 (2020).
22 A.R. Crimmins, C.W. Avery, and D.R. Easterling, “Fifth National Climate Assessment” (Washington, D.C.: United States Global Change Research Program, 2023), doi.org/10.7930/NCA5.2023.
23 Peter Ditlevsen and Susanne Ditlevsen, “Warning of a Forthcoming Collapse of the Atlantic Meridional Overturning Circulation” Nature Communications, no. 14 (2023): 4254.
24 “Climate Change in the Northeast U.S. Shelf Ecosystem,” NOAA Fisheries, June 17, 2025, accessed June 24, 2025, www.fisheries.noaa.gov/new-england-mid-atlantic/climate/climate-change-northeast-us-shelf-ecosystem.
25 Charles S. Yentsch, Janet W. Campbell, and Spencer Apollonio, “The Garden in the Sea: Biological Oceanography,” in From Cape Cod to the Bay of Fundy: An Environmental Atlas of the Gulf of Maine, ed. Philip W. Conkling (Cambridge, MA: MIT Press, 1995), 72.
26 The National Oceanic and Atmospheric Administration defines estuaries as “bodies of water where rivers meet the sea.” Estuaries are generally surrounded by wetlands, and are “among the most productive ecosystems in the world” as animals rely on brackish water, the mixture of fresh water draining from the land and salty seawater, for food, breeding, and migration stopovers. See “What is an estuary?” National Oceanic and Atmospheric Administration, accessed June 13, 2025, www.oceanservice.noaa.gov/facts/estuary.html.
27 There are over 200 species of fish and shellfish that are native to the Gulf of Maine, but only 40 to 50 with commercial value. Bruce B. Collette and Grace Klein-Macphee, Bigelow and Schroeder’s Fishes of the Gulf of Maine, 3rd ed. (Washington, D.C.: Smithsonian Books, 2002).
28 The Gulf of Maine Council on the Marine Environment defines the coastal zone as municipalities that border coastal or tidal water. The Council provides a comprehensive list of economical and socioecological impacts due to poor land use planning and sprawl development on the Gulf. See Gulf of Maine Council on the Marine Environment, “Coastal Land Use and Development,” State of the Gulf of Maine (Ogunquit, ME: Gulf of Maine Council on the Marine Environment, 2013), www.gulfofmaine.org/2/wp-content/uploads/2014/03/coastal-land-use-theme-paper.pdf.
29 Settler-colonial erasure involved both building over extant Native American sites and renaming them to erase the presence of Native Americans to further a mythical European origin story. See Jean M. O’Brien, Firsting and Lasting: Writing Indians Out of Existence in New England (Minneapolis: University of Minnesota Press, 2010).
30 Architectural historian Mark Jarzombek argues that this process is ongoing through current practices to include Native American names in local geography to obscure the violence of the ongoing territorial dispossession of indigenous peoples. See Mark Jarzombek, “The ‘Indianized’ Landscape of Massachusetts,” Places Journal, 2021.
31 For a list of threats and habitat degradation detailed by habitat and region across the Gulf of Maine, see David D. Platt, ed., Rim of the Gulf: Restoring Estuaries in the Gulf of Maine (Rockland, ME: Island Institute, 1998).
32 These issues were identified in the first publication from the Gulf of Maine Council on the Marine Environment in 1991. See Council on the Marine Environment, “Draft Gulf of Maine Action Plan,” Gulf of Maine Council Publications, 1991, https://digitalmaine.com/gulf_of_maine_council_docs/17.
33 The land area of the Gulf of Maine is divided between three states in the United States and three provinces in Canada. While 100% of the State of Maine is in the Gulf of Maine watershed, the other states and provinces: Massachusetts, New Hampshire, New Brunswick, Nova Scotia, and Quebec, are divided by other watersheds. Richard D. Kelly, Gulf of Maine Watershed (Augusta, ME: Maine State Planning Office, 1991), collections.leventhalmap.org/search/commonwealth:bk12dn70k.
34 Charles S. Yentsch, Janet W. Campbell, and Spencer Apollonio, “The Garden in the Sea: Biological Oceanography,” in From Cape Cod to the Bay of Fundy: An Environmental Atlas of the Gulf of Maine, ed. Philip W. Conkling (Cambridge, MA: MIT Press, 1995), 94-95.
35 The Department of Homeland Security identified an example in Saco, Maine, where a backup generator to provide electricity to wastewater pump stations during flood events would subject the Town to public utility regulations as an electric power distributor, thus preventing the Town from implementing a critical adaptation measure. United States Department of Homeland Security, “Casco Bay Region Climate Change Resiliency Assessment” (Washington, D.C.: United States Department of Homeland Security, 2016): 36, https://digitalcommons.usm.maine.edu/cgi/viewcontent.cgi?article=1192&context=cbep-publications.
36 At a national level, the United States Federal Emergency Management Agency (FEMA) has produced a series of flood plain maps that describe flood risk. Canada has not published a comparable publicly accessible data set. Individual states and provinces also produce data and risk assessments. Massachusetts, for example, has hired the Woods Hole Group to produce the Massachusetts Coastal Flood Risk Model (MC-FRM). The MC-FRM is a probabilistic model that combines sea level rise data with these factors, including storm induced flooding, wave run-up and overtopping flow on land and sea. The model uses historic storm events to predict future surges. The model uses high resolution topography data to project flooding risk at three different timescales: 2030, 2050, and 2070. The Massachusetts Coastal Flood Risk Model is available in an online map to see sea level rise and coastal flooding data. See “Sea Level Rise and Coastal Flooding Viewer, Massachusetts Office of Coastal Zone Management, 2024, www.experience.arcgis.com/experience/23d861b79aed450eb8972013dd28579b/page/MA-Coast-Flood-Risk-Model.
37 Maine Infrastructure Rebuilding and Resilience Commission, “A Plan for Infrastructure Resilience” (Augusta, ME: State of Maine, May 7, 2025): 52, www.maine.gov/future/sites/maine.gov.future/files/inline-files/Maine%20Infrastructure%20Resilience%20Plan_May2025.pdf.
38 The American Society of Civil Engineers (ASCE) provide an Infrastructure Report Card that describes the state of American infrastructure every four years. The ACSE 2025 report card gave a comprehensive grade of a C to the nation’s infrastructure systems. The ACSE further assigned the State of Maine a C for overall infrastructural performance, the State of New Hampshire a C-. They identify a continued gap in the data available on public infrastructure systems in the United States. They write, “unreliable or unavailable data on key performance indicators continues to impact certain infrastructure sectors… many infrastructure categories lack a basic inventory of assets and therefore are unable to implement asset management practices. Data – publicly available, routine, and reliable – should be standard across all infrastructure sectors to target investments and allow decision-makers to wisely allocate limited funding.” American Society of Engineers, “A Comprehensive Assessment of America’s Infrastructure,” Infrastructure Report Card (New York, N.Y.: American Society of Engineers, 2025), 4.
39 See Henry Petroski, The Road Taken: The History and Future of America’s Infrastructure (New York, NY: Bloomsbury, 2017).
40 U.S. Army Corps of Engineers and Bureau of Reclamation, “State of the Infrastructure: A Joint Report by the Bureau of Reclamation and the U.S. Army Corps of Engineers” (Washington, D.C.: U.S. Army Corps of Engineers and Bureau of Reclamation, December 2019).
41 Charles S. Colgan, Damon Yakovleff, and Samuel B Merrill, “An Assessment of the Economics of Natural and Built Infrastructure for Water Resources in Maine” (Portland, ME: University of Southern Maine and New England Environmental Finance Center, 2013).
42 In 1983, American economist Pat Choate wrote, “The United States is seriously underinvesting in public infrastructure. Because of tight budgets and inflation, the maintenance of a growing number of national and local public facilities has been deferred. Replacement and rehabilitation of obsolescent public works has been postponed. New construction has been cancelled, delayed, or ‘stretched out.’” This trend has continued. Pat Choate and Susan Walter, America in Ruins: The Decaying Infrastructure (Washington, D.C.: Council of State Planning Agencies, 1981): 1.
43 The United States Bureau of Economic Analysis publishes service life estimates for government non-residential structures. This data is used to understand how infrastructure depreciates as it ages. They are: 32 years for Industrial Buildings; 50 years for educational, hospital, and other buildings; 60 years for highway and streets, conservation and development, sewer systems, water systems, and other systems; and 50 years for military facilities. See “Capital Stock: Infrastructure Age,” US Army Corps of Engineers, accessed May 13, 2025, www.iwr.usace.army.mil/Missions/Value-to-the-Nation/Fast-Facts/Capital-Stock/Infrastructure-Age.
44 United States Department of Homeland Security, “Casco Bay Region Climate Change Resiliency Assessment” (Washington, D.C.: United States Department of Homeland Security, 2016): 3, https://digitalcommons.usm.maine.edu/cgi/viewcontent.cgi?article=1192&context=cbep-publications.
45 American Society of Engineers, “A Comprehensive Assessment of America’s Infrastructure,” Infrastructure Report Card (New York, N.Y.: American Society of Engineers, 2025): 3.
46 See Gulf of Maine Council on the Marine Environment, “Coastal Land Use and Development,” State of the Gulf of Maine (Ogunquit, ME: Gulf of Maine Council on the Marine Environment, 2013), www.gulfofmaine.org/2/wp-content/uploads/2014/03/coastal-land-use-theme-paper.pdf.
47 See Gulf of Maine Council on the Marine Environment, “Coastal Land Use and Development,” State of the Gulf of Maine (Ogunquit, ME: Gulf of Maine Council on the Marine Environment, 2013), www.gulfofmaine.org/2/wp-content/uploads/2014/03/coastal-land-use-theme-paper.pdf.
48 United States Department of Homeland Security, “Casco Bay Region Climate Change Resiliency Assessment” (Washington, D.C.: United States Department of Homeland Security, 2016): 3, https://digitalcommons.usm.maine.edu/cgi/viewcontent.cgi?article=1192&context=cbep-publications.
49 In Canada, the federal government has encouraged provincial governments to identify and designate flood risk areas, and use preventive and non-structural options like mapping and zoning to discourage development in designated flood zones. These agreements were meant to discourage structural measures like dams, dykes, channel improvements, flow regulations, ice booms, and floodproofing. See “Reducing flood damage,” Government of Canada, accessed January 20, 2025, www.canada.ca/en/environment-climate-change/services/water-overview/quantity/reducing-flood-damage.html.
50 Saltmarshes are one of the most biologically productive ecosystems on the planet, due to the amount of detritus that is produced by cordgrass (Spartina alterniflora) one of two dominant species in temperate salt marshes. Cordgrass grows in low marsh areas that are regularly inundated by high tide, while the other dominant grass species, saltmarsh hay (Spartina patens), grows in high marsh areas that are not inundated regularly. Carl Carlozzi, Kathryn King, William F. Newbold Jr., Ecosystems and Resources of the Massachusetts Coast (Boston, MA: Massachusetts Office of Coastal Zone Management, 1975), 13-15.
51 Landscape historian John Stilgoe provides a rich description of the history and cultural meaning of salt marshes from the Colonial period through the early twentieth century in Alongshore. He describes the end of profitable salt marsh haying in the late nineteenth century, and the beginning of salt marsh ditching in the 1910s in an attempt for property owners to drain their marshes. This practice was expanded as part of the New Deal, and also included a series of pest control programs, including the invention of greenhead fly traps, which are visible in marshes across the Gulf of Maine. See John Stilgoe, Alongshore (New Haven: Yale University Press, 2004).
52 Ecologists Keryn Gedan (nee Bromberg) and Mark D. Bertness identified a methodology to identify salt marsh loss in Boston using historic maps in response to a dearth of information about the location of former marshes and coastal development since colonization. See Keryn D. Bromberg and Mark D. Bertness, “Reconstructing New England Salt Marsh Losses Using Historic Maps,” Estuaries and Coasts 28 (2005): 823–32.
53 Machine learning using historic USGS maps makes this type of analysis possible in a shorter period of time. See Kira Clingen and Justin Booz, “A Machine Learning Model to Identify Historic Wetlands in an Area of Critical Environmental Concern,” Journal of Digital Landscape Architecture 10 (2025): 330–38.
54 The U.S. Department of Interior produces an annual report on wetland status and trends as part of an effort to manage wetlands. See M.W. Lang, J.C. Ingebritsen, and R.K. Griffin, “Status and Trends of Wetlands in the Conterminous United States 2009 to 2019” (Washington, D.C.: U.S. Department of Interior Fish and Wildlife Service, 2019).
55 Philip W. Conkling, ed., From Cape Cod to the Bay of Fundy: An Environmental Atlas of the Gulf of Maine (Cambridge, MA: MIT Press, 1995), 127.
56 Impervious surfaces are hard surfaces such as roads, driveways, and roofs that do not allow water to infiltrate into the ground. As watersheds are urbanized, vegetation is replaced by impervious surfaces, reducing the area where infiltration to groundwater can occur. This increases the amount of stormwater runoff that drains across roads, driveways, patios, and roofs, collecting debris, pollutants and chemicals, vehicular fluids, sand, and salt before entering storm sewers, ditches, or swales. See “Impervious Surfaces and Flooding,” United States Geological Survey, accessed August 1, 2024, www.usgs.gov/s pecial-topics/water-science-school/science/impervious-surfaces-and-flooding
57 See David D. Platt, ed., Rim of the Gulf: Restoring Estuaries in the Gulf of Maine (Rockland, ME: Island Institute, 1998).
58 Siddarth Narayan et al., “The Value of Coastal Wetlands for Flood Damage Reduction in the Northeastern USA,” Nature Scientific Reports 7 (2017), https://doi.org/10.1038/s41598-017-09269-z.
59 The International Union for the Conservation of Nature defines nature-based solutions as “actions to protect, sustainably manage, or restore natural or modified ecosystems to address societal challenges, simultaneously providing benefits for people and the environment.” “IUCN Global Standard for Nature-Based Solutions: A User-Friendly Framework for the Verification, Design and Scaling up of NbS” (Gland, Switzerland: IUCN, 2020), portals.iucn.org/library/sites/library/files/documents/2020-020-En.pdf.
60 The term “ecological infrastructure” was first used by the UNESCO Man and Biosphere Program in 1984. The design of ecological infrastructure emphasizes “the integration of ecological ideas into the design of municipal infrastructure at the initial stage of project construction, taking into account the inherent ecological losses caused by municipal infrastructure to ensure the integrity of structure and function of ecosystems, and provides ecosystem services needed for sustainable development.” Shoukai Sun, Yuantong Jiang, and Shuanning Zheng, “Research on Ecological Infrastructure from 1990 to 2018: A Bibliometric Analysis,” Sustainability 12, no. 6 (2020).
61 A briefing regarding United Nations Sustainable Development Goal 11: Make Cities and Human Settlements Inclusive, Safe, Resilient and Sustainable notes that “as of 2015, 75% of global urban infrastructure that will exist in 2050 has yet to be built.” This provides an opportunity to invest in a different way of building infrastructure systems than the status quo. United Nations, “Sustainable Development Goal 11: Make Cities and Human Settlements Inclusive, Safe, Resilient and Sustainable,” Sustainable Development Goal Issue Brief (Geneva: United Nations, 2015), wedocs.unep.org/bitstream/handle/20.500.11822/25763/SDG11_Brief.pdf.
62 The terminology around green, gray, ecological, blue-green, and natural infrastructure has evolved from different agencies and disciplines, and is shifting. As such, there is not a common term or definition that describes the benefits of these systems. The United States Environmental Protection Agency defines gray infrastructure through the lens of stormwater management as “traditional stormwater infrastructure in the built environment such as gutters, drains, pipes, and retention basins.” In this report, green infrastructure, defined as infrastructure from the neighborhood to country scale that “mimics nature and captures rainwater where it falls, and includes permeable pavement, rain gardens, bioretention cells, vegetative swales, infiltration trenches, green roofs, planter boxes, rainwater harvesting, rooftop disconnection, and urban tree canopies,” is used interchangeably with nature-based solutions. See “Green and Gray Infrastructure Research,” United States Environmental Protection Agency, accessed June 1, 2025, www.epa.gov/water-research/green-and-gray-infrastructure-research.
63 Decentralized systems are characterized by locating infrastructure facilities and distribution networks close to sites of consumption, flexibility, local ownership, management, and independent control. Decentralization strategies vary by system, such as electric microgrids or passive wastewater systems.
64 Engineer Deb Chachra argues that “infrastructure systems remain an important means to reduce human suffering and decrease energy.” She further argues that decentralized systems that are local, sustainable, and appropriate can emerge instead of top-down, resource-extracting, carbon dioxide intensive systems that have been developed in the Global North during the 20th century, and that ultimately, these systems can return power to communities. Deb Chachra, How Infrastructure Works: Inside the Systems That Shape Our World (New York: Riverhead Books, 2023).
65 Maine Infrastructure Rebuilding and Resilience Commission, “A Plan for Infrastructure Resilience” (Augusta, ME: State of Maine, May 7, 2025):6, www.maine.gov/future/sites/maine.gov.future/files/inline-files/Maine%20Infrastructure%20Resilience%20Plan_May2025.pdf.
66 Economists Charles S. Colgan, Damon Yakovleff, and Samuel B. Merrill compiled a synthetic report of the “natural” and “built” water infrastructure approaches. They conclude, “it is sometimes better not to build in certain areas than to always impose structural solutions.” Charles S. Colgan, Damon Yakovleff, and Samuel B Merrill, “An Assessment of the Economics of Natural and Built Infrastructure for Water Resources in Maine” (Portland, ME: University of Southern Maine and New England Environmental Finance Center, 2013): 9.
67 U.S. Chamber of Commerce, Allstate, and U.S. Chamber of Commerce Foundation, “The Preparedness Payoff: The Economic Benefits of Investing in Climate Resilience” (Washington, D.C.: U.S. Chamber of Commerce, 2024), www.uschamber.com/assets/documents/USCC_2024_Allstate_Climate_Resiliency_Report.pdf.
68 According to the Federal Emergency Management Agency, “hazard mitigation planning reduces loss of life and property by minimizing the impact of disasters. It begins with state, tribal and local governments identifying natural disaster risk and vulnerabilities that are common in their area. After identifying these risks, they develop long-term strategies for protecting people and property from similar events. Mitigation plans are key to breaking the cycle of disaster damage and reconstruction.” “Hazard Mitigation Planning,” Federal Emergency Management Agency, accessed September 15, 2024, www.fema.gov/emergency-managers/risk-management/hazard-mitigation-planning.
69 MyCoast is an online platform for people in Massachusetts to document flooding conditions. “MyCoast: Massachusetts,” Office of Coastal Zone Management, accessed May 10, 2025, mycoast.org/ma.
70 The Gulf of Maine Research Institute has identified a series of coastal monitoring sites and encourages people to contribute photos of high water and evidence of flooding in an attempt to connect sea level rise and storm surge projections with on-the-ground observations. “Coastal Flooding: Storms and Sea Level Rise,” Gulf of Maine Research Institute, accessed May 10, 2025, investigate.gmri.org/project/coastal_flooding.
71 There are several design guidelines and compilations of nature-based infrastructural solutions. As an example, see Pamela Conrad and Kotchakorn Voraakhom, “WORKS with Nature: Low Carbon Adaptation Techniques for a Changing World” (Washington, D.C.: American Society of Landscape Architects, 2024), www.climatepositivedesign.org/wp-content/uploads/2024/12/241205_WorksWithNature.pdf.
72 The Gulf of Maine Council keeps a record of habitat conservation efforts around management concerns to facilitate a more coordinated, regional approach. See “Habitat Conservation,” Gulf of Maine Council on the Marine Environment, www.gulfofmaine.org/habitatconservation.
73 The Gulf of Maine Council on the Marine Environment highlights ongoing restoration actions and responses across the Gulf. See Glenn A. Benoy et al., “Watershed Status: State of the Gulf of Mainort” (Gulf of Maine Council on the Marine Environment, 2016).